


Between September 2025 and August 2026, 10 major Western defense and defense-technology companies increased their postings for computer and information research scientists by 176%. Over the same period, their postings for software and web developers, programmers, and testers fell 9%.
Total posting flow across the 10 rose 24%, so research roles did not simply rise with everything else. They went from 2.3% of all advertised positions to 5.1%, while the developer share fell from 10.1% to 7.4%. A year ago, these companies advertised roughly 4.4 developer roles for every research-scientist role. They now advertise 1.4.
The group comprises RTX (NYSE: RTX), Lockheed Martin (NYSE: LMT), Northrop Grumman (NYSE: NOC), General Dynamics (NYSE: GD), BAE Systems (LSE: BA.), Thales (Euronext Paris: HO), Leonardo (Borsa Italiana: LDO), Saab (Nasdaq Stockholm: SAAB B), Rheinmetall (Xetra: RHM), and Anduril. Anduril is privately held and sits in the set because it competes for the same engineers.
Every company outgrew its own hiring rate
The move is not one company pulling an average. All 10 increased research-scientist postings, and all 10 did so faster than they grew hiring overall. RTX led at 285% against total posting growth of 56%. Northrop Grumman posted 216% against 45%, Lockheed Martin 163% against 36%, and BAE Systems 254% against 100%. The two companies that cut hiring overall still added research roles: General Dynamics grew research postings 61% while total postings fell 25%, and Saab grew them 183% while its total fell 6%.
Figure 1: Research-scientist growth ran ahead of each company’s own total hiring growth, in every case
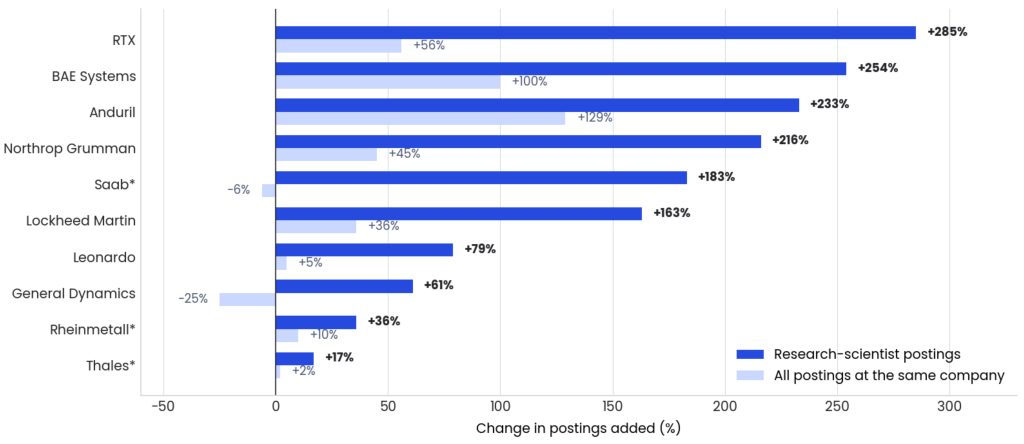
*Research-scientist change calculated on a base of fewer than 100 postings.
Source: GlobalData Jobs Analytics
Developers went the other way at seven of the 10. General Dynamics cut developer postings 45%, Thales 35%, Saab 32%, Rheinmetall 25%, and Leonardo 24%. Lockheed Martin and RTX slipped only marginally, by 6% and 1%. Three added: BAE Systems, up 114%, Anduril, up 25%, and Northrop Grumman, up 12%.
Table 1: Change in postings added, by company and occupation group
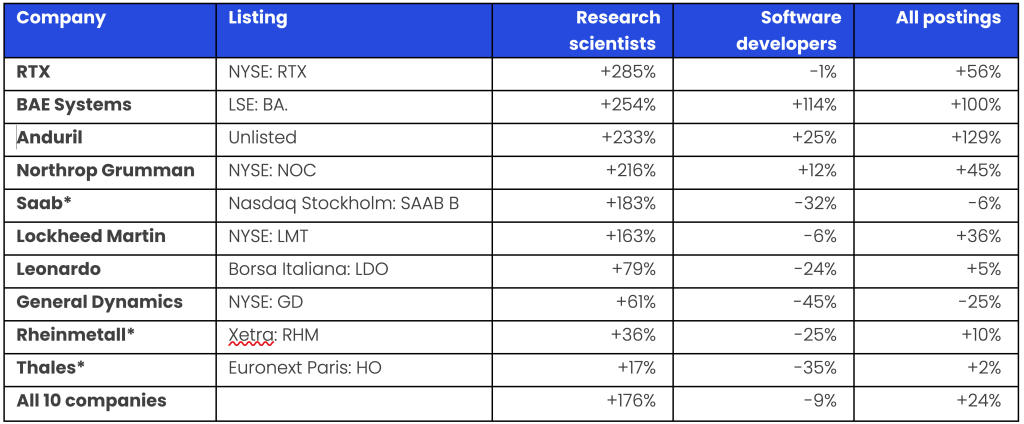
Note: 12 months to August 2026 against the 12 months to August 2025. *Research-scientist change calculated on a base of fewer than 100 postings. Listings shown are primary local listings; several of these companies also trade as depositary receipts in the US.
Source: GlobalData Jobs Analytics, LinkUp
Checking the finding against a second classification
Occupation codes are assigned by the data provider, and they moved between the two windows. One catch-all engineering category grew more than tenfold, which no operating change explains. Any finding built on a single occupation code needs a check that does not depend on occupation codes.
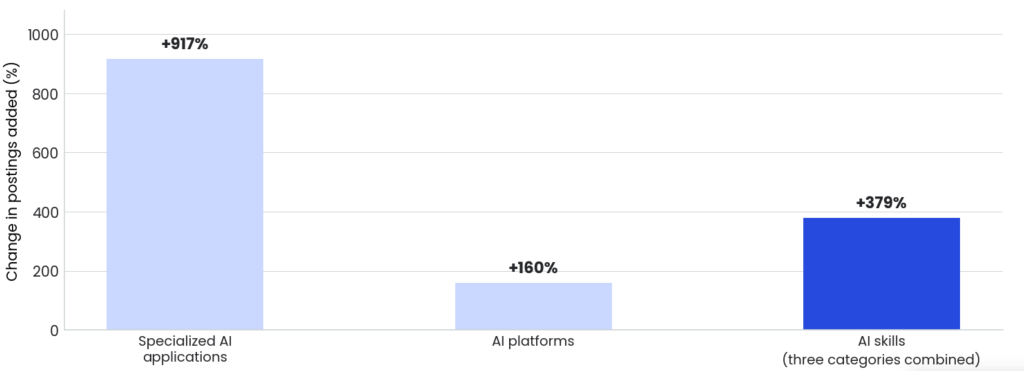
The postings carry a separate skills classification, derived from the text of the job description rather than from the job title. Read through that layer, demand for specialised AI applications rose more than tenfold and AI platforms by 160%, with AI hardware climbing from a negligible base. The three AI skill categories grew 379% together. Two classifications built from different inputs moving the same way is not something a change to either one alone would produce.
Figure 3: The skills classification, built from job text rather than job titles, shows the same shift
Source: GlobalData Jobs Analytics, LinkUp
The skills layer confirms direction, not magnitude, and one gap is worth stating. It shows conventional IT demand falling much faster than the occupation data does: application development is down 61% against a 9% decline in developer job titles. Those measure different things, a skill named in the description against a role named in the title, but the distance between them is wide enough that the skills numbers should be read as a direction check rather than a second estimate. A count of raw job titles would settle it, and that check is still outstanding.
The occupation data also shows a production ramp, and it deserves less confidence
On growth rates the research shift is not the fastest thing in this data. Postings for aircraft mechanics and service technicians rose 283%, aerospace engineers 151%, machinists 103%, and electrical and electronics engineers 76%. That reads as a build-rate ramp across airframes, munitions, and electronics, which is what European rearmament and the US munitions programmes would predict, and it sits far closer to near-term revenue than research hiring does.
It should be held more loosely than the research finding. The categories that contracted are the engineering-support and IT layer: industrial engineers down 40%, engineering technologists and technicians down 53%, database and network administrators down 47%, and computer hardware engineers down 47%. A genuine build ramp that sheds its process engineers and its technicians at the same time is not a coherent picture. The likelier reading is that some technician roles were re-coded into the trade categories between the two windows. The research finding has a second classification standing behind it. This one does not.
What makes the research shift worth separating is that order books and delivery guidance already describe the production ramp, while nothing in reported figures describes a near-tripling in advertised research demand. It also runs on a different clock. Company-funded research is expensed as it is incurred, ahead of any programme revenue it eventually supports, although a substantial share of research at the US primes is customer-funded or recovered through overhead rates on government contracts, which mutes the effect on reported margin.
Absent from their own theme
These companies are barely participating in the deal wave around the technology they are now hiring for. AI-themed deal activity in aerospace and defense nearly doubled between 2023 and 2025. The first eight months of 2026 have already run 11% above the whole of 2025 on volume, and disclosed value is tracking at roughly two and a half times last year’s full-year total.
These 10 companies appear in under 3% of AI-themed aerospace and defense transactions recorded since 2021. Their share peaked at 4.3% in 2025 and stands at 1.7% so far in 2026.
Venture financing accounts for just over half of transactions in that pocket, which explains part of the absence because primes rarely join venture rounds. It does not explain all of it.
Two readings fit. The companies may have decided the autonomy layer is capability to own rather than a component to source. Or they may be unable to buy it: large prime acquisitions have faced a harder antitrust environment since the FTC’s 2022 challenge that led Lockheed Martin to abandon its Aerojet Rocketdyne deal, and average disclosed value per AI deal in this pocket has more than doubled YoY. The hiring data looks identical under both readings.
What would settle it
What would settle it is whether company-funded research and development disclosure moves in the direction the postings imply over the next two reporting cycles. If it does not, this was exploratory rather than funded. Another factor is whether developer postings recover, which would make this a one-year pause rather than substitution, and whether participation in AI transactions picks up across 2027, which would weaken the build-rather-than-buy reading considerably.
Postings measure advertised demand, not completed hires. The data shows the direction and the breadth of the shift. It cannot size the cost.
Operating signals like this sit in routine company data long before they reach a financial statement. Hiring records describe what a company is doing while its reported figures still describe what it did.
GlobalData’s whitepaper, ‘Human Capital’ Alpha from Jobs Dataset, tests whether that holds systematically. Building and back-testing S&P 500 portfolios ranked on three job-based indicators, it reports 4% to 6% annualised alpha over the index across seven years, and 3% to 15% over specialist human capital indexes. Those are the whitepaper’s results, from an analysis separate to the one above. Download it for the method and the full results.
